
 Cristian Gonzalez
September 22, 2026
Cristian Gonzalez
September 22, 2026
Building on an earlier blog, where we reconstructed a football match in 3D for the Novel View Synthesis challenge, we continue exploring SoccerNet 2026 with another of its challenges: Player-Centric Ball Action Spotting.
The Player-Centric Ball Action Spotting challenge takes a normal broadcast and asks, when something happens to the ball, what was the action, when did it happen, and which player did it?
The winning solution, PAVE, builds on the challenge's baseline and teaches it to read each action using information about the players around it. In this blog we explore how it works, where it succeeds, where it still struggles, and how close it brings us to a play-by-play produced straight from the broadcast.
To learn what happened and who did it, a model needs matches where the answers are already known: every player followed through the broadcast, and every touch of the ball tied to the player who made it.
The FOOTPASS dataset provides that for 54 full matches from the 2023/24 season of Ligue 1, the Bundesliga, Serie A, La Liga and the Champions League. The players are detected and tracked with computer vision models, identified by team and shirt number, and placed on the pitch from the camera's position. The ball actions, more than 100,000 of them, were then labelled by hand by a team of professional annotators.
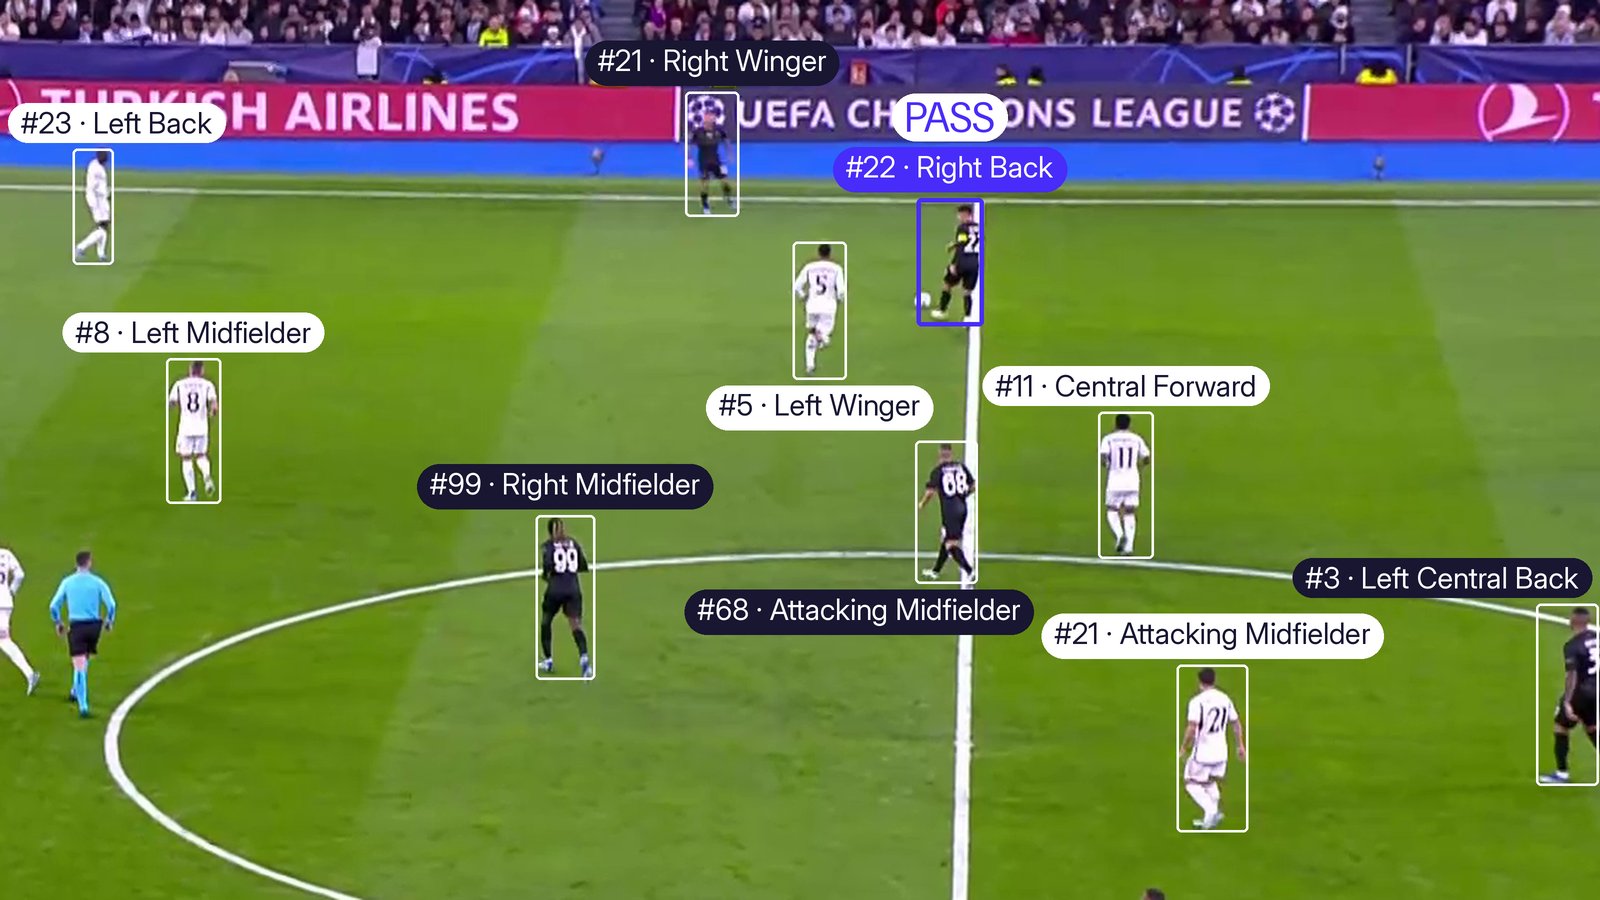
So every match the model learns from comes in two parts: the broadcast footage, and a structured description of what happens in it.
The challenge considers eight types of ball action, each marked as a single moment in the video:
Drive: receiving the ball and carrying it.
Pass: playing the ball towards a teammate.
Cross: playing the ball from a wide area towards the penalty area.
Shot: an attempt on goal.
Header: intentionally playing the ball with the head.
Throw-in: putting the ball back into play from the sideline.
Tackle: taking the ball from an opponent.
Block: stopping an opponent's pass or shot.
Their distribution in the dataset is very uneven, ranging from more than 50,000 passes to only around 300 tackles.
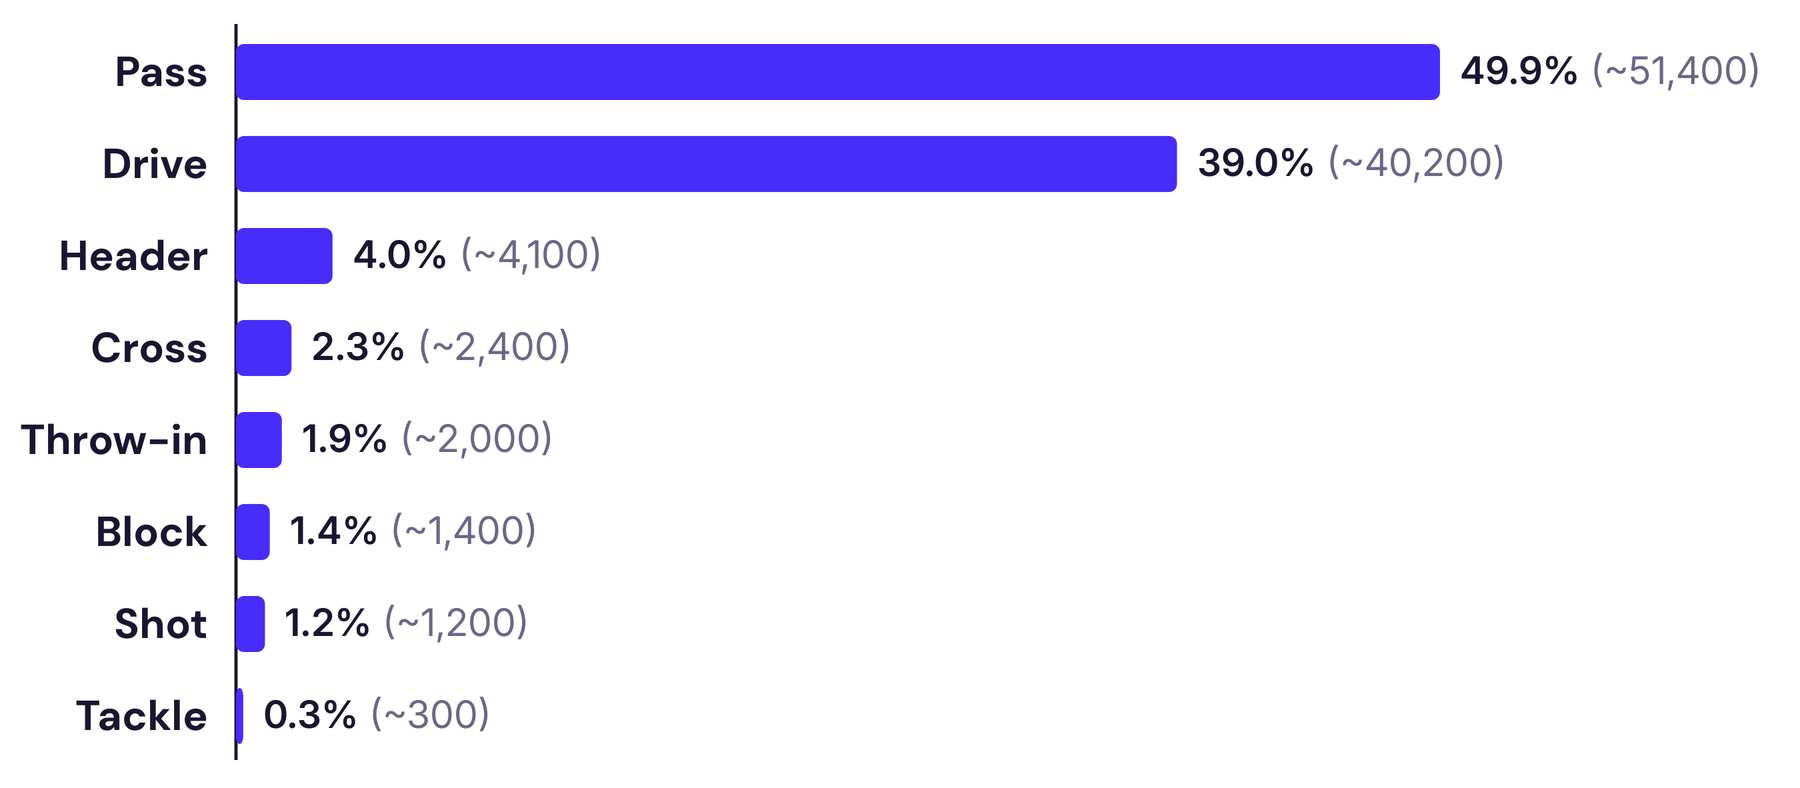
That imbalance is one of the central difficulties of the task: a model can be very good at the actions that happen constantly and still miss most of the rare ones.
PAVE was created by Faisal Altawijri and Ismail Mathkour, and works in two stages, like the pipeline provided with the challenge.
The first stage, the Track-Aware Action Detector or TAAD, goes player by player: for each one it takes a short sequence of frames and estimates how likely each of the eight actions is at each moment. PAVE lets it look at the whole sequence of frames together, instead of judging each moment almost on its own.
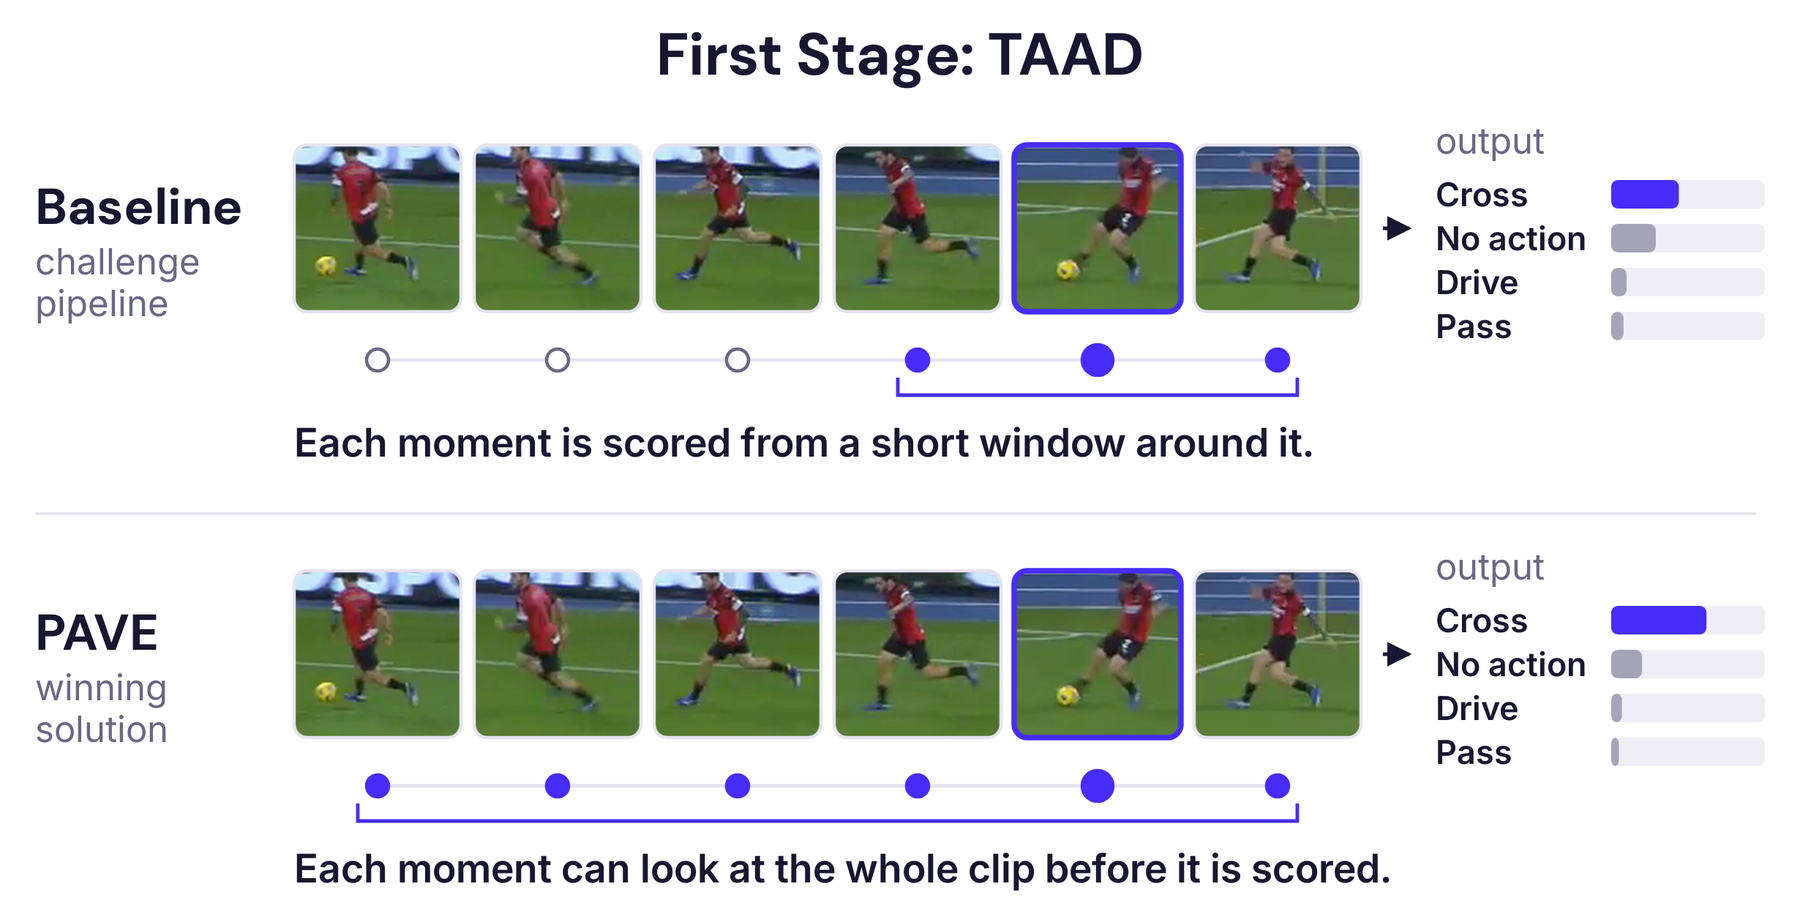
On its own, scoring each player separately produces many false alarms, and it ignores how actions are connected, like a cross from one player that is met by a header from another.
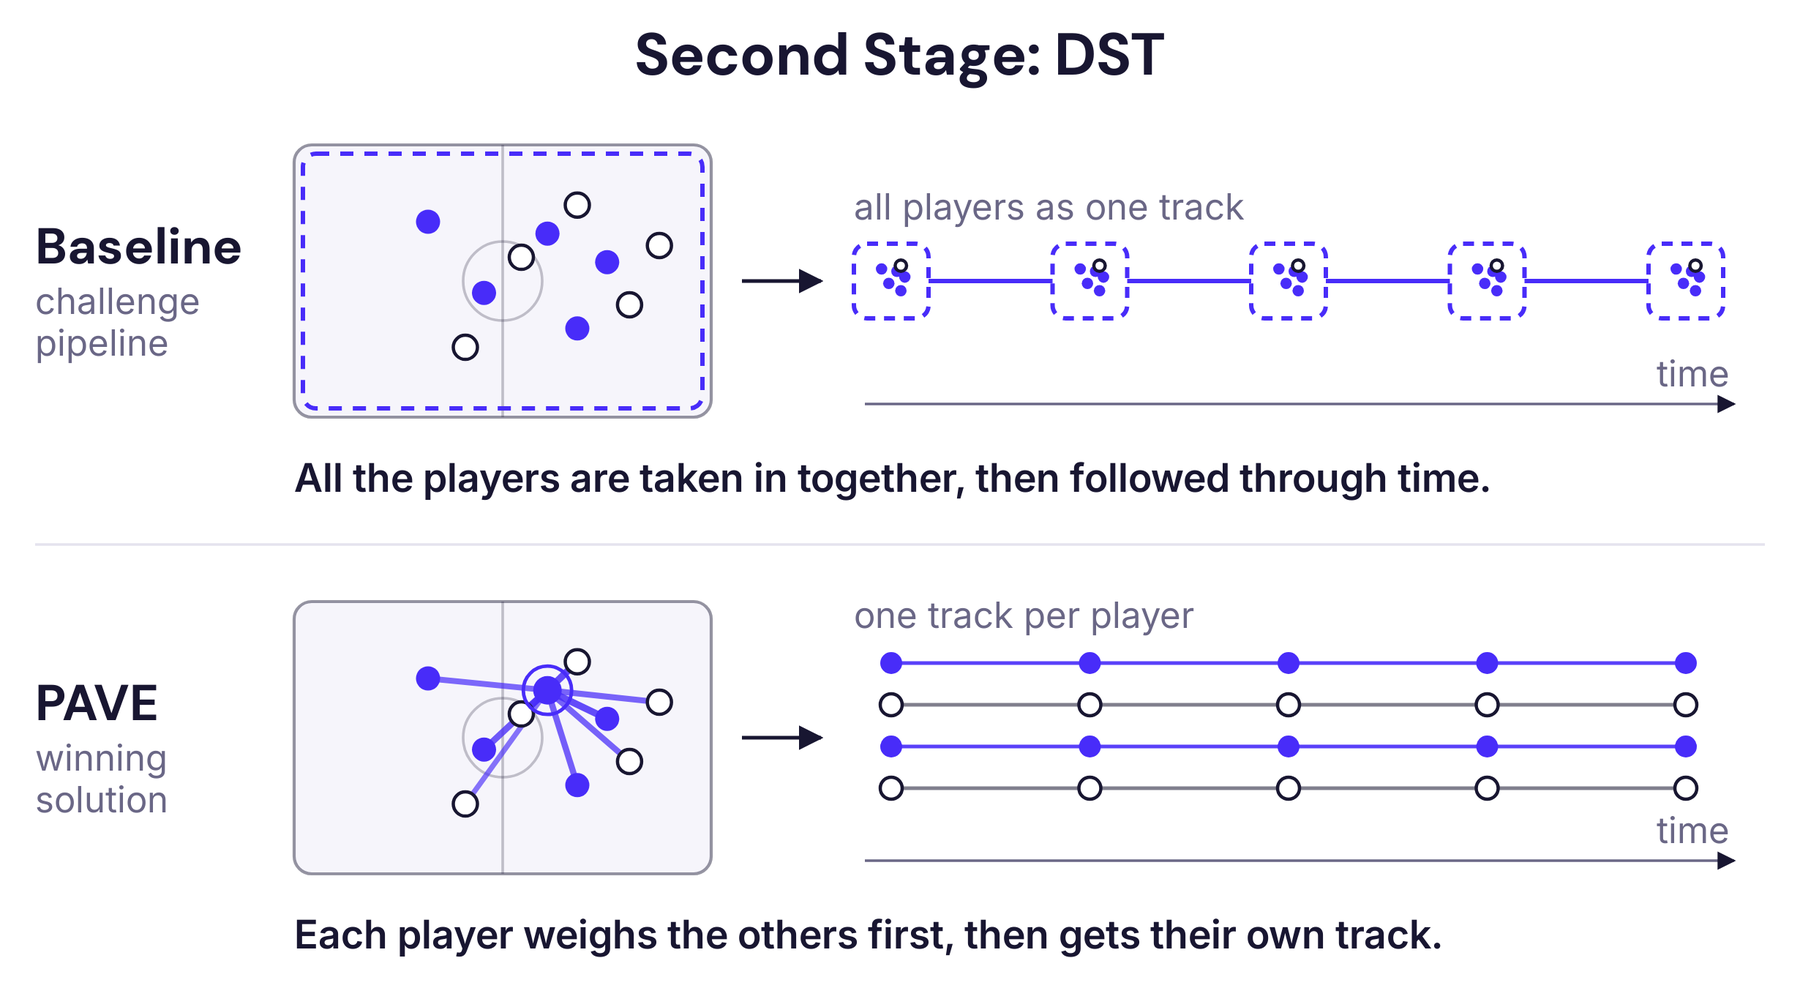
So the scores go to a second stage, the Denoising Sequence Transduction model or DST, which combines those scores with the location of each player and how they are moving, and turns them into a clean sequence of actions. In this stage, PAVE introduces its most important change.
In the baseline, the second stage takes in all the players together at each moment and follows the play through time. PAVE adds an attention step before that, a technique that lets each player weigh how much every other player matters, based on where they are and how they are moving. Only then is each player followed through time. This gives the model a picture of the play at every moment: who is close to whom, where the opponents are, and how everyone is arranged around the ball.
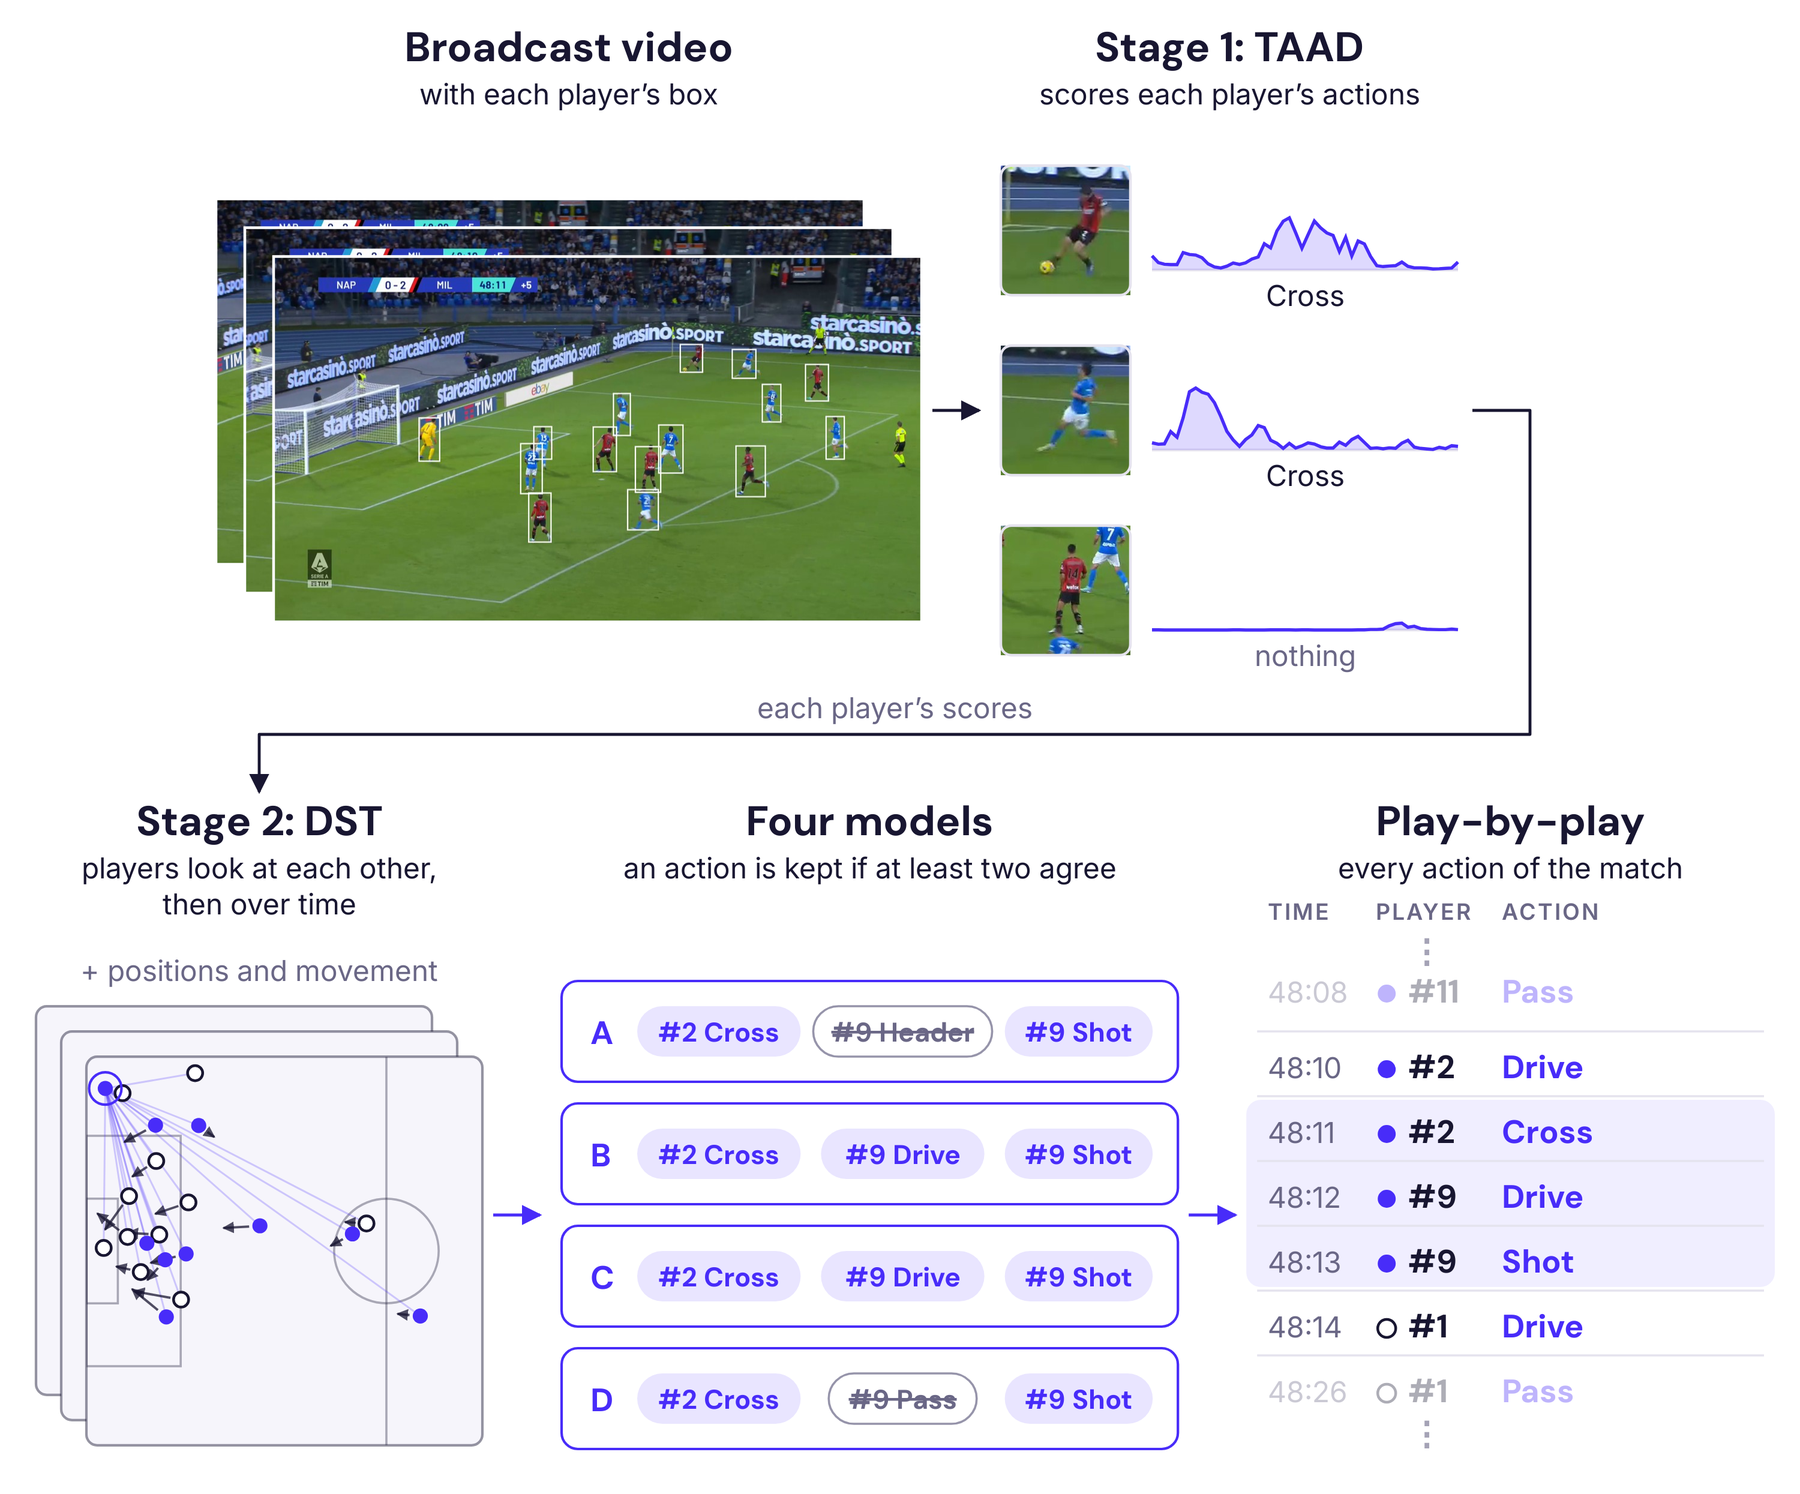
PAVE also trains four different models for this second stage, each built slightly differently, and runs all of them on the same match. An action is kept only when at least two of the four models predict it. Tackles are the exception: they are so rare that PAVE keeps them even when only one model finds them.
The whole pipeline can be seen below on one real moment of a match, from the broadcast to the final play-by-play.
The challenge scores predictions with Macro F1, where a prediction only counts as correct when the action, the moment and the player all match the annotation. The score balances how many predictions were correct against how many of the real actions were found, and averages this over the eight actions so rare ones count as much as common ones, with higher being better.
PAVE reached 58.94 on the challenge set, a group of matches whose annotations are not made public, against 46.41 for the baseline that came with it. The largest share comes from letting the players look at each other, with the improved first stage and the combination of the four models adding the rest.
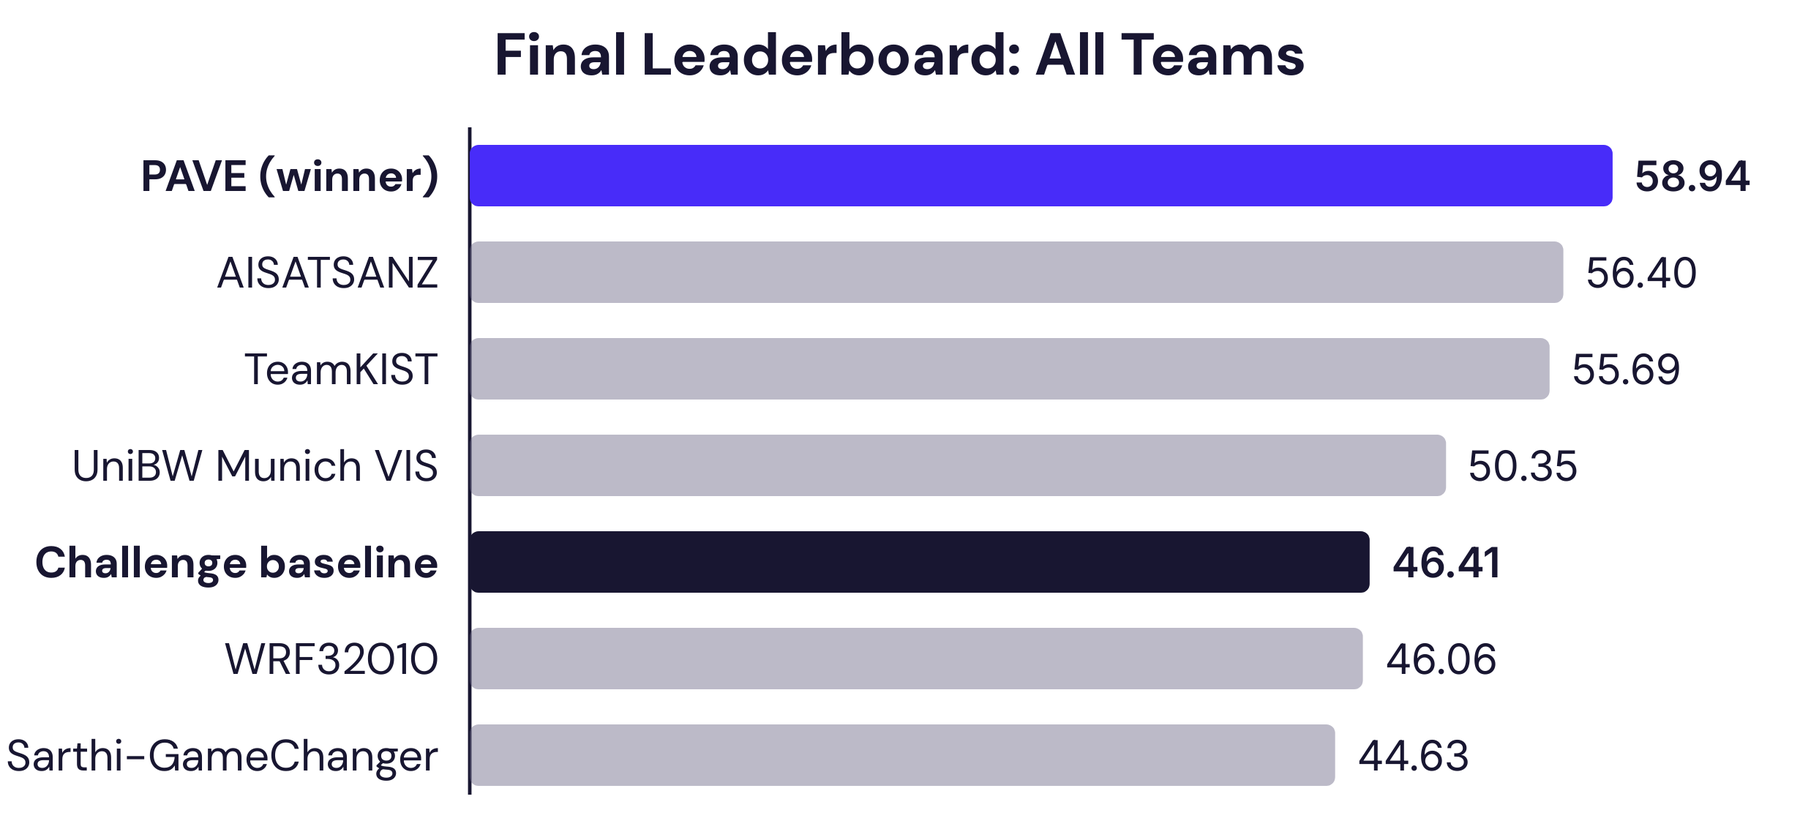
To see what those numbers look like on real footage, we trained PAVE ourselves and overlaid its predictions on matches it was not trained on.
The model follows a large part of the game well: passes and drives appear at roughly the right moments and on the right players, and whole sequences often come out right, like a pass that is carried down the wing, crossed and turned into a shot.
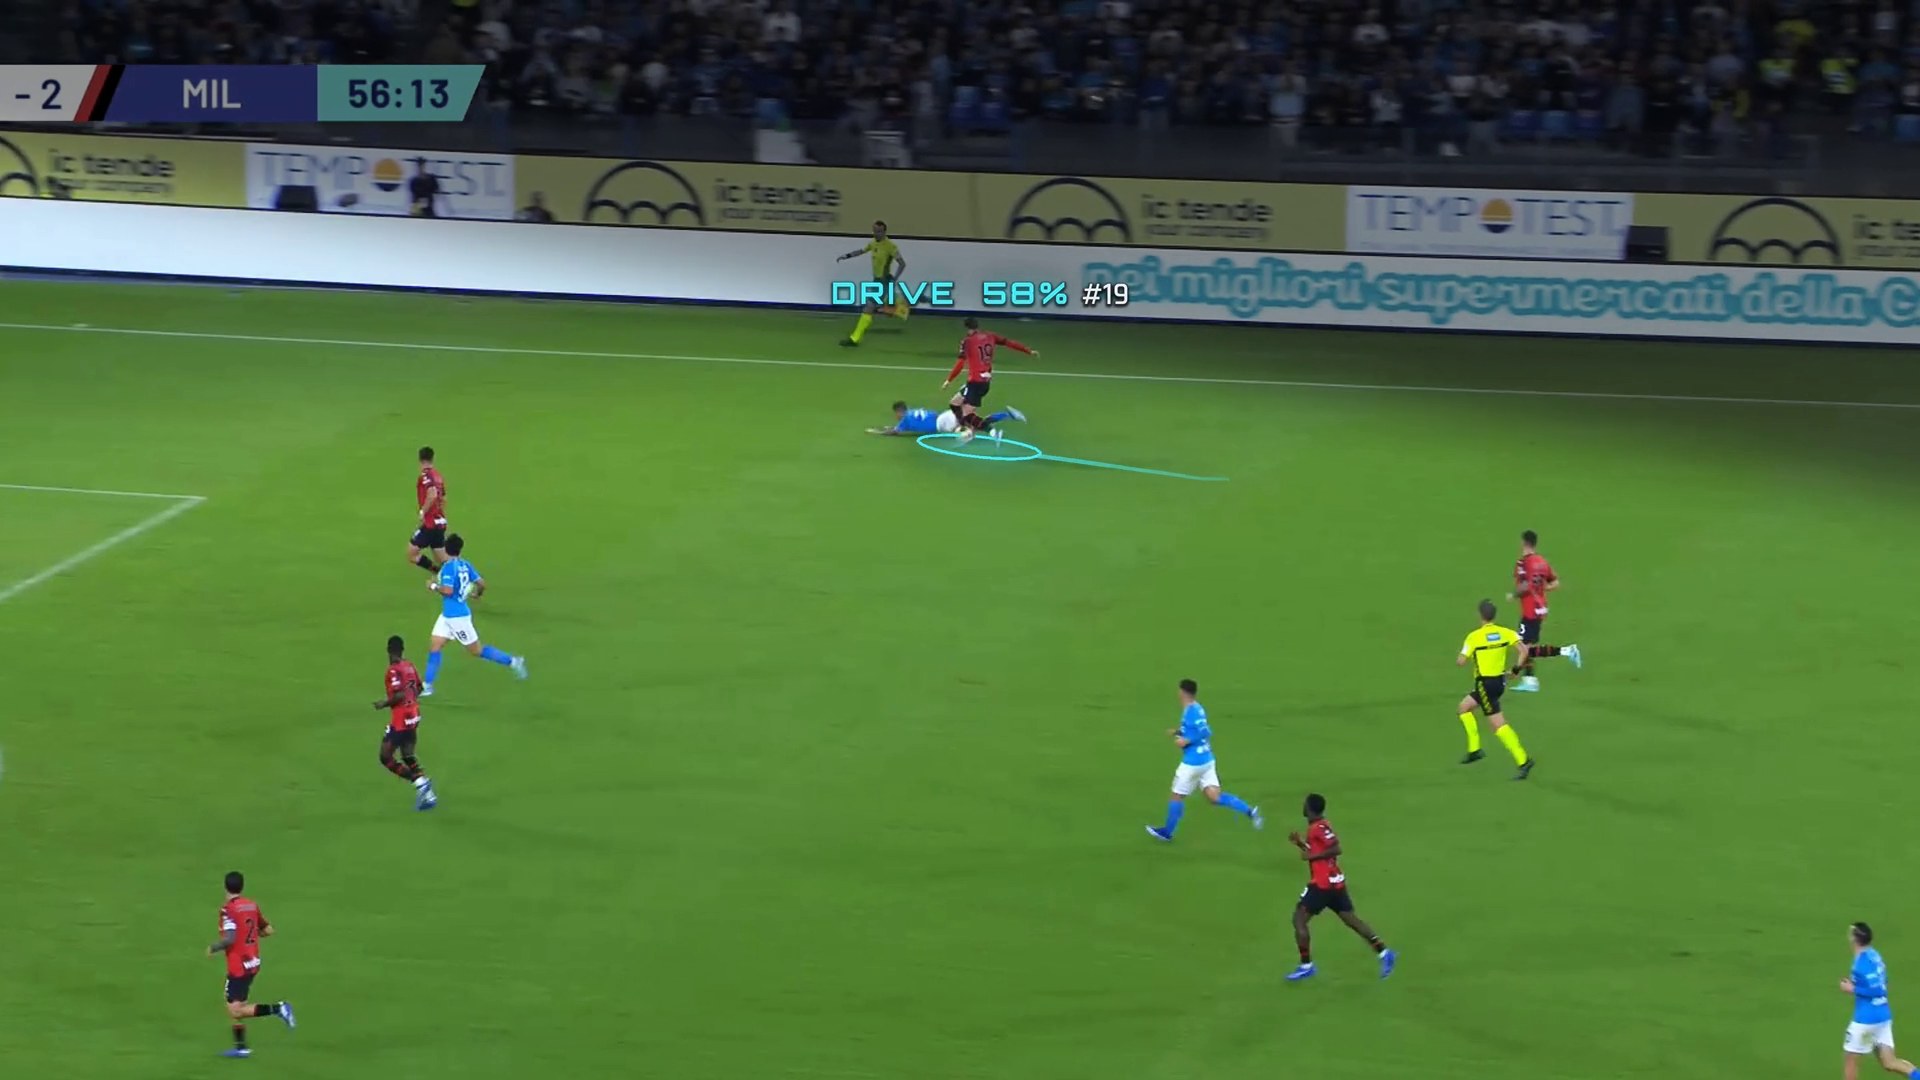
It still makes mistakes, as in this tackle in the middle of the pitch, where it finds the right moment and the right player but reads the action as a drive.
The per-action scores show a clear gap between common and rare events. Passes, drives and throw-ins are found reliably, crosses and shots reasonably well, headers and blocks less so, and tackles rarely.
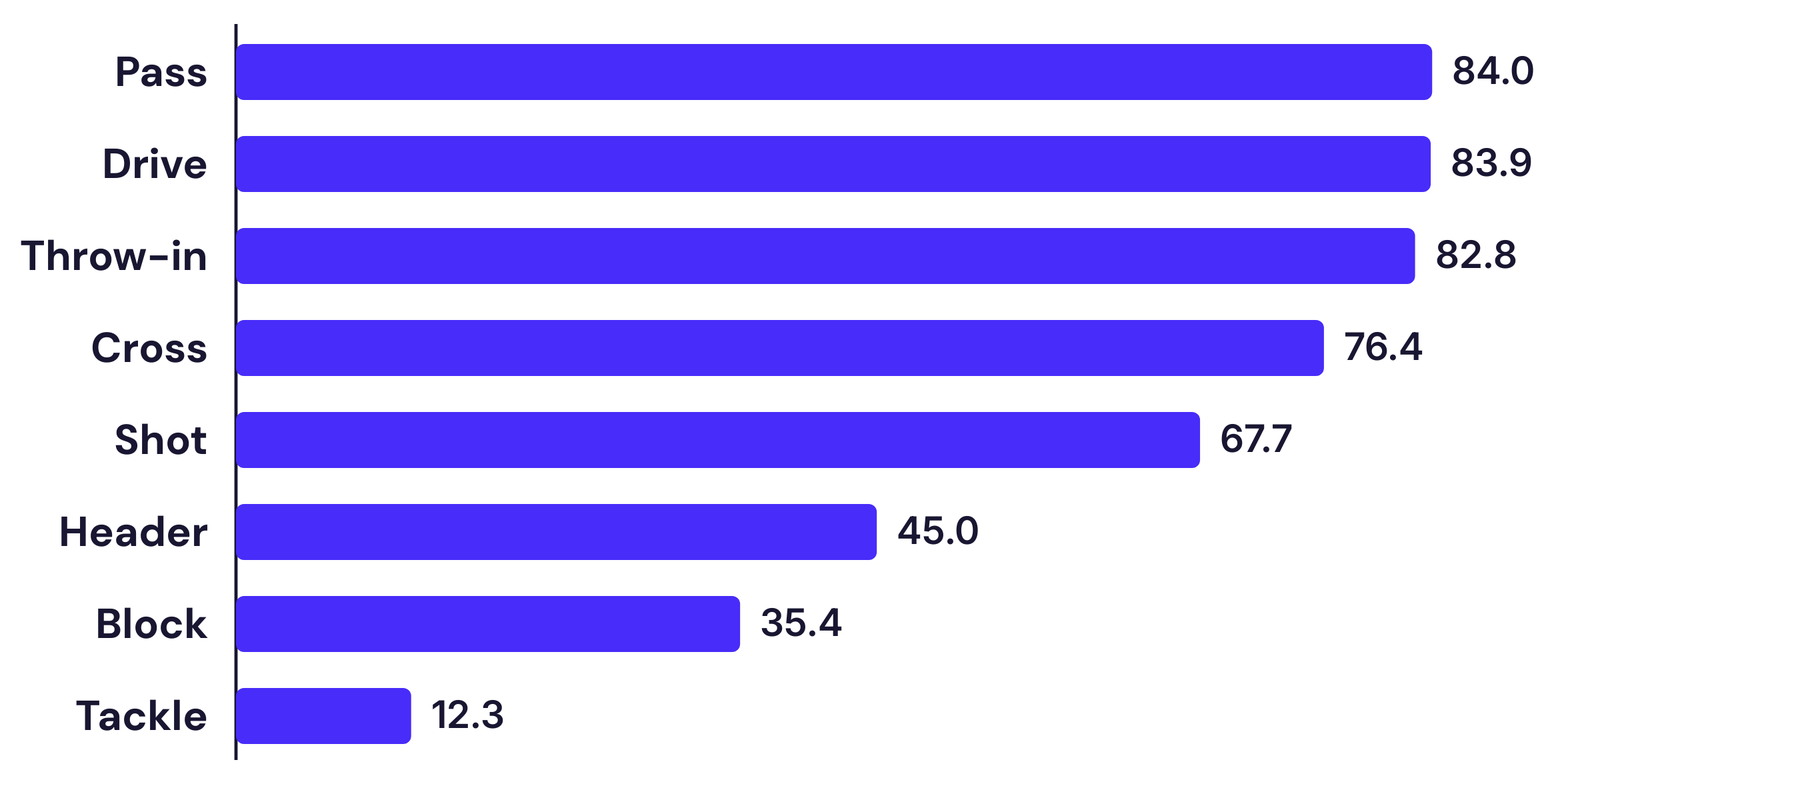
Training data is part of it, since there are far more passes than tackles to learn from. But some actions are also ambiguous in a broadcast: two players can arrive at the ball together, a block can happen in a crowded penalty area, and a header is hard to see when the ball is small or hidden.
According to the FOOTPASS authors, play-by-play data is still largely annotated by hand, by trained operators who go through the footage to label each action. In a single edition of the challenge, the winning solution raised the score from 46.41 to 58.94, and on the most common actions, passes, drives and throw-ins, it scores above 80.
The same authors note that models like this are typically used to assist annotation rather than to automate it fully, and they chose the challenge's scoring with that use in mind: removing a wrong suggestion is faster than searching the video for an action that was missed.
These methods also rely on knowing where every player is, which team they play for and which shirt number they wear before they can say who did what. Finding and following the players, reading their numbers and placing them on the pitch are research areas of their own, with their own datasets, so a reliable play-by-play also depends on progress there. As both sides improve, the models that read the actions and the tracking they build on, a play-by-play produced straight from the broadcast gets closer, with people checking it rather than writing it from scratch.